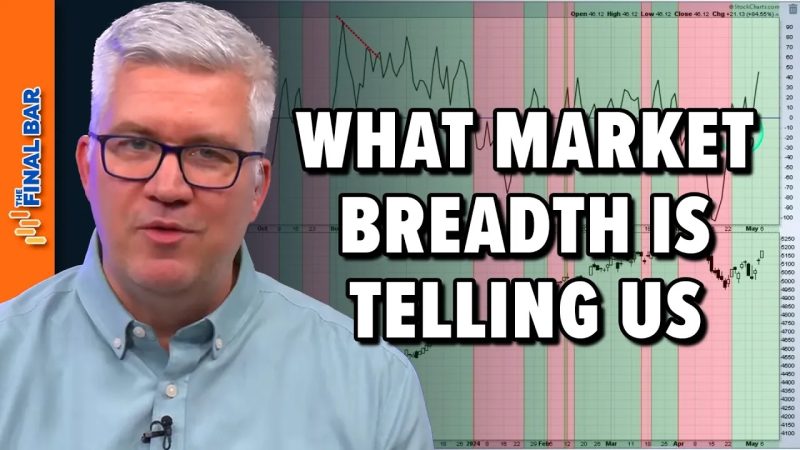
The Market Breadth Indicator You Should Be Following
In the world of finance and investing, numerous indicators and metrics are used to gauge the health and direction of the market. One such indicator that has gained popularity among investors and analysts is the Market Breadth Indicator. This powerful tool provides valuable insights into the overall market sentiment and can help investors make informed decisions about their portfolios.
Market breadth refers to the number of individual stocks advancing versus declining within a particular index or market. A high market breadth indicates broad participation in the market rally, suggesting that a majority of stocks are trending upwards. On the other hand, a low market breadth implies that only a small number of stocks are driving the market higher, which can be a sign of weakness and potential market correction.
One commonly used market breadth indicator is the Advance-Decline Line (AD Line). The AD Line is calculated by taking the difference between the number of advancing stocks and declining stocks and adding it to the previous value of the AD Line. By tracking the AD Line, investors can discern whether the market is being driven by a few strong stocks or if there is widespread participation among various stocks.
Another important market breadth indicator is the McClellan Oscillator. This indicator uses the difference between the 19-day EMA (Exponential Moving Average) and 39-day EMA of advancing and declining issues to measure market breadth momentum. A positive McClellan Oscillator reading indicates that the market breadth is strong, while a negative reading suggests weak breadth and potential market downside.
Investors should pay close attention to these market breadth indicators as they can provide valuable insights into market trends and potential turning points. By analyzing market breadth data, investors can better assess the underlying strength of the market and make more informed decisions about their investment strategies.
In conclusion, market breadth indicators like the Advance-Decline Line and McClellan Oscillator are essential tools for investors looking to navigate the complexities of the stock market. By tracking these indicators and understanding their implications, investors can gain a deeper understanding of market sentiment and position themselves for successful investing.

