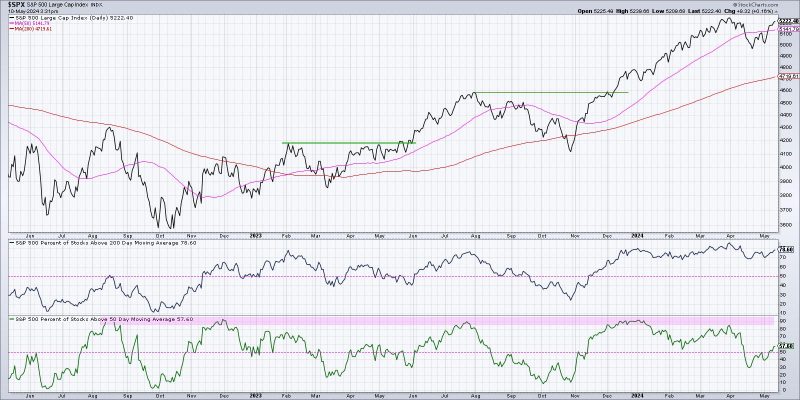
In recent times, the fluctuations in stock market trends have left investors and traders eager to uncover reliable indicators that point towards a bullish market trend. For novice traders and seasoned investors alike, a critical aspect of making sound investment decisions involves assessing the health and direction of the overall market. This article explores three key breadth indicators that can provide valuable insights into confirming a bullish market trend.
1. Advance-Decline Line (AD Line):
The Advance-Decline Line, often abbreviated as AD Line, is a breadth indicator that measures the cumulative difference between advancing and declining stocks in a given market index. This indicator provides a broad view of market participation by considering the number of stocks moving higher versus lower. A rising AD Line indicates that more stocks are advancing than declining, suggesting underlying strength in the market. When the AD Line is trending higher alongside the overall market index, it confirms a bullish trend. Conversely, a declining AD Line may signal a potential reversal or weakness in the market.
2. New Highs-New Lows Index:
The New Highs-New Lows Index is another breadth indicator that helps assess market breadth by tracking the number of stocks hitting new highs versus new lows. In a healthy bull market, investors typically see a higher number of stocks reaching new highs, reflecting broad-based strength across various sectors. Conversely, a narrowing new highs-new lows spread could indicate internal weakness and a potential shift in market sentiment. Traders often look for confirmation of a bullish trend when the majority of stocks are making new highs, suggesting overall market strength and positive investor sentiment.
3. McClellan Oscillator:
The McClellan Oscillator, developed by Sherman and Marian McClellan, is a popular breadth indicator used to assess market breadth and momentum. This oscillator is derived from the difference between the 19-day and 39-day exponential moving averages of advancing and declining issues. A positive value indicates that advancing stocks are gaining momentum, while a negative value suggests declining stocks are dominant. Traders interpret the McClellan Oscillator as a measure of market internals, with high positive values confirming a bullish trend and low negative values signaling potential weakness.
In conclusion, monitoring key breadth indicators can provide traders and investors with valuable insights into confirming a bullish market trend. By analyzing market breadth alongside price movements, investors can better navigate the complexities of the stock market and make informed investment decisions. While no indicator is foolproof, combining multiple breadth indicators can offer a comprehensive view of market health and direction, helping traders stay ahead of market trends and make profitable trades.

