**Analysis of the Double Top Pattern on Semiconductors (SMH)**
The semiconductor industry plays a vital role in the global economy, with semiconductors being a key component in various electronic devices. In recent times, the SMH (VanEck Vectors Semiconductor ETF) has shown a double top pattern, indicating a potential trend reversal. Understanding the implications of this pattern is crucial for investors looking to make informed decisions.
**What is the Double Top Pattern?**
A double top pattern is a technical analysis charting pattern that signals a potential reversal in an asset’s price trend. It is formed when the price of an asset reaches a high level, retraces, then rallies again to a similar high before declining. The pattern resembles the letter M and is indicative of a shift from a bullish trend to a bearish one.
**Interpreting the Double Top on Semiconductors (SMH)**
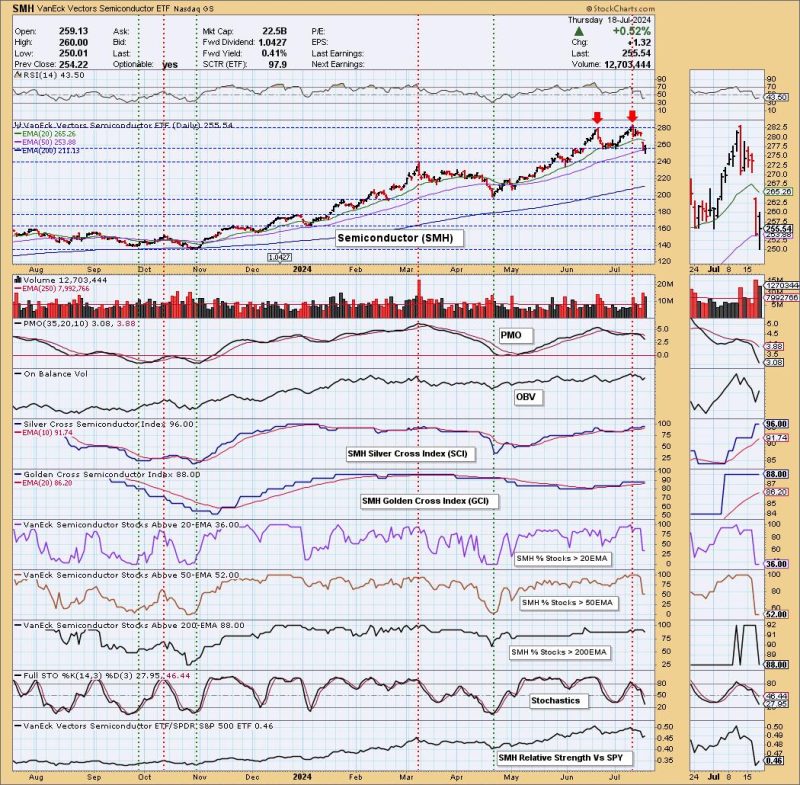
The SMH ETF has exhibited a double top pattern, with the price reaching a peak, retracing, and then rallying to form a second peak at approximately the same level as the first. This pattern suggests that the bullish momentum in the semiconductor sector may be weakening, and a trend reversal could be imminent.
**Implications for Investors**
For investors tracking the semiconductor industry, the double top pattern on SMH serves as a cautionary signal. It indicates that the previous uptrend in semiconductor stocks may be losing steam, potentially leading to a downward movement in prices. Investors should exercise caution and consider adjusting their positions accordingly to manage risk effectively.
**Key Factors to Monitor**
When analyzing the double top pattern on SMH, investors should focus on key factors that could confirm or invalidate the reversal signal. Monitoring trading volume, price action around the resistance level, and broader market trends can provide valuable insights into the strength of the pattern and the likelihood of a trend reversal.
**Conclusion**
In conclusion, the double top pattern on Semiconductors (SMH) highlights the importance of technical analysis in identifying potential trend reversals in the stock market. Investors should pay close attention to chart patterns like the double top and combine them with other analytical tools to make well-informed investment decisions. By remaining vigilant and adaptable, investors can navigate market fluctuations and capitalize on opportunities presented by changing trends.

