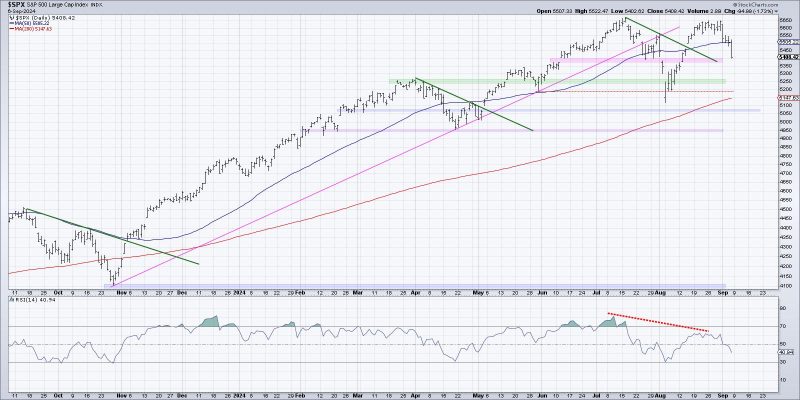
In the world of investing, market tops are a cause of concern for many traders and investors. Identifying when the market has reached its peak is crucial to avoid significant losses and potentially take advantage of upcoming opportunities. By analyzing three key charts, investors can better understand the current market conditions and make informed decisions.
Chart 1: Price-to-Earnings (P/E) Ratio
One of the most commonly used indicators to determine the valuation of the market is the Price-to-Earnings ratio. This ratio compares the current price of a stock or index to its earnings-per-share, providing insights into whether the market is overvalued or undervalued. A high P/E ratio may indicate that stocks are overpriced relative to their earnings, signaling a potential market top.
In the chart provided, we can observe the historical trend of the P/E ratio for the S&P 500 index. When the P/E ratio reaches elevated levels compared to its historical average, it could suggest that the market is overheated and due for a correction. Investors should be cautious when the P/E ratio is significantly above its long-term average, as it may indicate an unsustainable market rally.
Chart 2: Margin Debt
Margin debt refers to the amount of money that investors borrow to purchase securities. High levels of margin debt can be a warning sign of excessive speculation and market exuberance. When investors are heavily leveraged, a market downturn could lead to forced selling, exacerbating the decline in prices.
In the chart illustrating margin debt levels, we can see how peaks in margin debt have often coincided with market tops in the past. Investors should monitor margin debt as a contrarian indicator – when margin debt reaches extreme levels, it may be a sign that the market is due for a correction.
Chart 3: Volatility Index (VIX)
The Volatility Index, also known as the VIX or fear index, measures market expectations for future volatility. A low VIX reading suggests that investors are complacent and expect minimal fluctuations in the market, which can precede a sharp reversal or market top.
By examining the VIX chart, investors can gauge sentiment and market risk appetite. Spikes in the VIX often coincide with market bottoms or tops, indicating periods of heightened uncertainty and potential market reversals. When the VIX is at historically low levels, investors should exercise caution and consider hedging strategies to protect their portfolios from sudden market downturns.
Conclusion
Analyzing these three key charts – the Price-to-Earnings ratio, Margin Debt, and Volatility Index – can provide valuable insights into the current state of the market and help investors navigate potential risks. By monitoring these indicators and understanding their implications, investors can make more informed decisions and prepare for market tops before they materialize. Remember, timing the market perfectly is challenging, but staying vigilant and being prepared for different scenarios is essential for long-term investment success.

