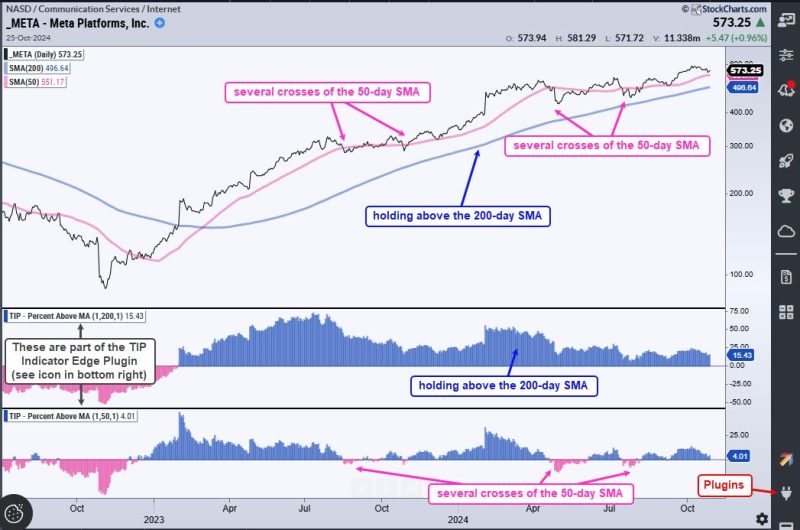
Indicator 1: Volume Profile
The Volume Profile is a technical analysis indicator that displays the distribution of trading volume over specific price levels. It provides valuable insights into the market structure and helps traders identify significant support and resistance zones.
By analyzing the Volume Profile, traders can determine the areas where there is significant trading activity, which can help them make more informed trading decisions. For example, if a stock has a strong volume cluster at a certain price level, it indicates that there is a high level of interest in buying or selling at that level.
Additionally, the Volume Profile can be used to identify potential price targets and stop-loss levels. Traders can use volume nodes as reference points to set profit targets and determine the risk-reward ratio for their trades.
Overall, incorporating the Volume Profile into your trading strategy can significantly improve your edge in the market by providing a deeper understanding of price action and volume dynamics.
Indicator 2: Relative Strength Index (RSI)
The Relative Strength Index (RSI) is a momentum oscillator that measures the speed and change of price movements. It is a widely used technical indicator that helps traders identify overbought and oversold conditions in the market.
The RSI is plotted on a scale of 0 to 100, with readings above 70 considered overbought and readings below 30 considered oversold. Traders can use the RSI to generate buy and sell signals based on these extreme levels.
By incorporating the RSI into your trading strategy, you can improve your edge by identifying potential reversals and trend continuations. For example, if the RSI is in the overbought territory and starts to decline, it could signal a potential reversal to the downside.
Traders can also use the RSI to confirm price trends and filter out false signals. When the RSI is trending in the same direction as the price, it validates the strength of the trend and increases the probability of a successful trade.
In conclusion, utilizing the Relative Strength Index in conjunction with other technical indicators can enhance your trading edge by providing valuable insights into market momentum and potential price reversals. By combining the Volume Profile and RSI, traders can develop a more comprehensive trading strategy that increases their chances of success in the market.

