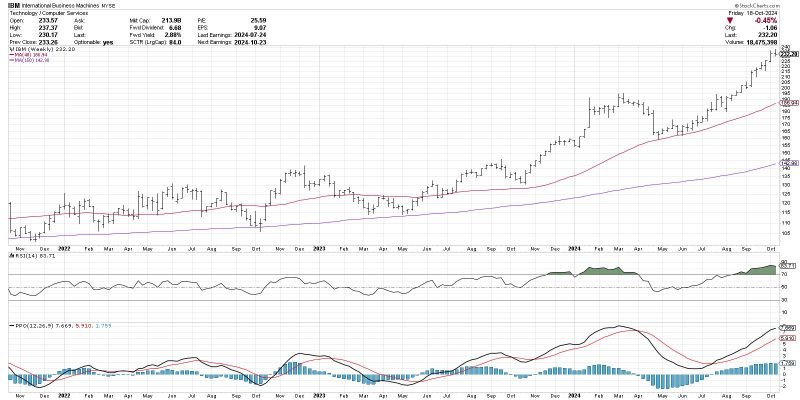
The MACD Histogram: An Indispensable Tool for Anticipating Trend Changes
Understanding trend changes in the financial markets is a crucial aspect of successful trading. Traders and investors are constantly seeking tools and indicators that can help them forecast these changes accurately. One such tool that has gained popularity for its ability to anticipate trend changes is the MACD histogram.
The MACD (Moving Average Convergence Divergence) histogram is a powerful technical indicator used by traders to identify potential changes in the direction of a trend. By analyzing the relationship between two moving averages – the MACD line and the signal line – the MACD histogram can provide insights into the strength and momentum of a particular trend.
One of the key features of the MACD histogram is its ability to signal potential trend reversals before they actually occur. When the MACD histogram crosses above the zero line, it indicates that the short-term moving average has crossed above the long-term moving average, suggesting a bullish trend. Conversely, when the MACD histogram crosses below the zero line, it indicates a bearish trend reversal.
The histogram’s shape and movement can also provide valuable information to traders. A rising histogram suggests increasing momentum in the trend, while a falling histogram indicates weakening momentum. The size of the histogram bars can also indicate the strength of the current trend, with larger bars suggesting greater momentum.
Traders often use the MACD histogram in conjunction with other technical indicators to confirm trend changes. For example, they may look for divergence between the price chart and the MACD histogram, which can signal a potential trend reversal. Additionally, observing the MACD histogram in relation to key support and resistance levels can provide further confirmation of trend changes.
While the MACD histogram is a valuable tool for anticipating trend changes, it is important for traders to exercise caution and use it in conjunction with other indicators and analysis techniques. Like all technical indicators, the MACD histogram is not infallible and should be used as part of a comprehensive trading strategy.
In conclusion, the MACD histogram is a versatile and powerful tool that can help traders anticipate trend changes in the financial markets. By analyzing the relationship between moving averages and interpreting the histogram’s shape and movement, traders can gain valuable insights into the direction and momentum of a trend. While no indicator can predict market movements with absolute certainty, the MACD histogram is a valuable addition to any trader’s toolkit.

